

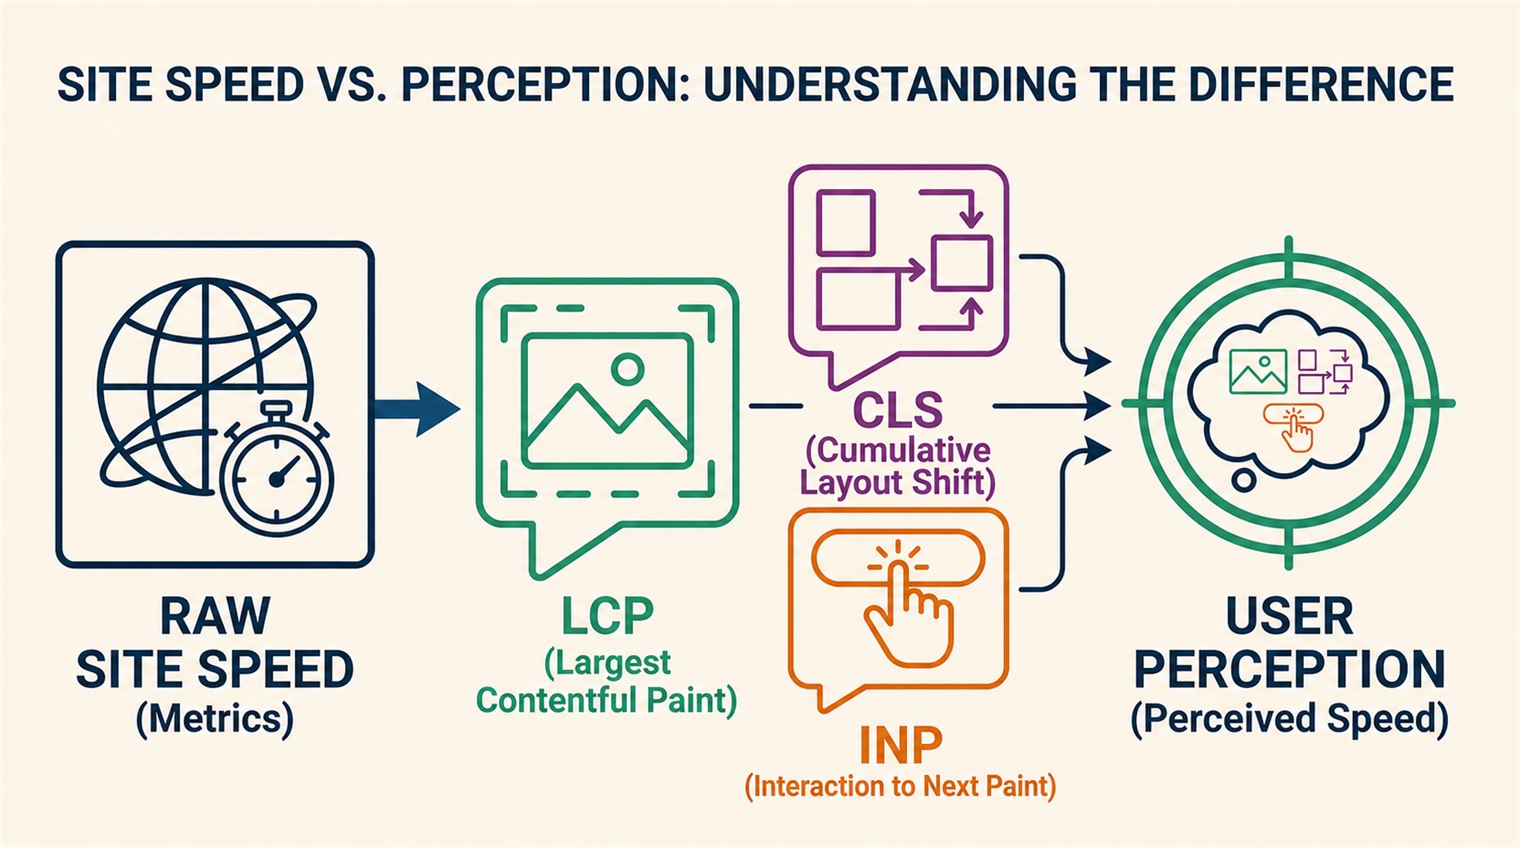
A PageSpeed score is not your site speed. It is one controlled run of a page, combined on the same screen with a separate report about real visitors. Those are useful measurements. They are not interchangeable, and treating them as one is how a business gets told a site is slow when the actual problem is a single image, or told it is fast because a circular score happened to turn green.
Here's the quick version:
- Core Web Vitals are three real-user measurements: LCP for loading, INP for responsiveness, and CLS for layout stability.
- PageSpeed Insights shows two kinds of data: a Lighthouse lab test that helps you diagnose a page, and 28 days of Chrome user data when Google has enough of it.
- A high score can hide a field problem, and a low score can be a useful lab clue rather than a customer emergency. Read the label above the number before you react to it.
- Your page can feel fast and still have a poor metric. It can also get a mediocre lab score while most real visitors have a good experience. The job is to find out which situation you have.
How To Read PageSpeed Insights: Scores, Field Data, Lab Data, And Audits
This is why people get confused. The report puts a performance score, Core Web Vitals, field data, lab data, and a stack of audits in the same place. It looks like one diagnosis. It is not.
Read the report from top to bottom, but keep the questions separate:
- The performance score comes from one Lighthouse lab run. It answers what happened during that controlled test.
- LCP, INP, and CLS field data come from the Chrome User Experience Report. They answer what real Chrome users experienced over the prior 28 days.
- Lab metrics and audits give a developer places to investigate, such as a slow lead image or a blocking script.
- Improvement suggestions are things to test next. They are not a verdict that every warning must be fixed.
Google's own PageSpeed Insights documentation says the tool provides both lab and field data. The lab run is useful for debugging. The field data is useful because it describes what real users experienced. That distinction is the whole article.
The score at the top is not a pass or fail grade for your business. It is a weighted Lighthouse score from a controlled run. It is good at giving a developer a reproducible place to start. It is bad at answering, by itself, whether your customers are waiting too long for a quote form to respond on their own phones.
Does a 90 PageSpeed score mean my site passes the Core Web Vitals assessment? No. The 90 is a Lighthouse performance score from one controlled test. Core Web Vitals are based on LCP, INP, and CLS at the 75th percentile of real visits, when enough field data exists. A page can score 90 in the lab and still fail a field metric, or score lower in a lab test while real users are doing fine. Read both sections before deciding there is a problem.
The Three Metrics That Most Deeply Impact Perceived Load Times For Your Visitors
Core Web Vitals are not a general word for site speed. They are three defined measurements, and they describe three different failures:
- LCP: the main content is still not visible. The good threshold is 2.5 seconds or less.
- INP: a click, tap, or form action takes too long to respond. The good threshold is 200 milliseconds or less.
- CLS: the page jumps while the visitor is trying to read or click. The good threshold is 0.1 or less.
The target is the 75th percentile of page loads, separated across mobile and desktop. In plain English, you do not pass because one visit was quick. You pass when most people, including people on weaker phones and slower connections, have a good experience.
LCP is the one most owners notice first. It marks when the largest visible image or block of text has rendered. A slow server response, a huge lead image, a render-blocking script, or a page making the browser wait on JavaScript can all hold it up. A high TTFB makes a good LCP difficult, sometimes impossible.
INP is different. It happens after the page is on screen, when somebody clicks a menu, starts a form, changes a product option, or taps a call button. That is why a page can look quick in a screenshot and still feel aggravating in use. CLS is different again. It is the ad, cookie notice, late-loading image, or font that moves the button just as somebody tries to tap it.
If an older audit tells you to optimize First Input Delay, it is out of date. INP replaced FID as the responsiveness Core Web Vital in 2024, because it measures interactions across the page visit instead of only the first one. Chrome's INP update explains the change.
When did INP replace First Input Delay? In March 2024. FID only recorded the delay before the first interaction began. INP looks at how quickly the page responds across interactions during a visit, which is closer to the frustration a visitor experiences when a form, menu, or button hesitates.
How Core Web Vitals Changed, And Why
Google did not wake up one day and decide that a score should outrank good content. The change has been toward measuring whether a page is usable for people, while keeping relevance at the center of search.
- 2020: Google introduced the original set of Core Web Vitals. LCP, FID, and CLS gave site owners a common way to talk about loading, initial responsiveness, and visual stability. Google also published the thresholds so teams could measure the same definitions instead of making up their own.
- 2021: Core Web Vitals became part of the Page Experience rollout. Google rolled the update out from June through August and was clear that these signals were one part of page experience, not a replacement for relevance or useful content. Google's rollout announcement still makes that distinction well.
- 2024: INP replaced FID. A page can respond well to its first tap and still bog down when someone uses the menu, fills out a form, or clicks a call button. INP measures that broader interaction experience, which is why it replaced the narrower FID metric.
- Today: the goal is a usable page, not a trophy score. Google uses Core Web Vitals as one input among many. The most relevant page can still rank when its metrics are imperfect, but a fast, stable, responsive page gives that content a better chance to work for the visitor who reaches it.
Core Web Vitals Matter For Search, But Relevance Still Comes First
Google says Core Web Vitals are used by its ranking systems. That does not turn a green report into a ranking guarantee, and it does not make a 100 PageSpeed score an SEO strategy. Google also says there is no single page-experience signal and that it will still seek to show the most relevant content, even when that page's experience is less than ideal. Its page-experience guidance says trying to get a perfect score purely for SEO may not be the best use of your time.
The useful goal is simpler: remove the friction that keeps a visitor from seeing the page, using the form, or trusting what they see. Good content and a usable page work together. Neither one cancels out the other.
Lab Data And Field Data Disagree Because Of Differing Load Conditions
Lighthouse starts from a clean, controlled visit. It simulates a defined device and network condition. That makes it useful for comparing a change against the same baseline and for catching things such as oversized images or blocking scripts.
Field data is messier because people are messier. It includes visitors with different phones, different connections, cached assets, cookie banners, extensions, and behavior after the initial load. PageSpeed Insights gets that field data from Chrome's public dataset, and it covers the prior 28 days when the URL or origin has enough qualifying visits.
PageSpeed Insights makes the distinction clear: lab data is one simulated experience, while field data is a distribution of real experiences. A difference is not a broken report. It is often the most useful clue on the page.
Do not call missing field data a failure. New sites and lower-traffic pages often do not have enough Chrome user data for a field report. That means you need a lab trace to diagnose obvious problems and, ideally, your own real-user monitoring to learn what visitors experience. It does not mean the site failed a test it never took.
Why PageSpeed Can Show No Field Data
Chrome does not publish the exact number of visits a URL needs before it appears in CrUX. The page must be public and indexable, and it must have enough eligible visits to produce a meaningful distribution. If PageSpeed does not have URL-level data, it can show origin-level data instead. If neither has enough samples, it shows no field data. Chrome's CrUX methodology confirms both the eligibility rules and the undisclosed popularity threshold.
CrUX is useful, but it is not the same thing as your analytics. It reflects eligible Chrome visits on supported desktop and Android platforms, not every browser or every customer. Chrome on iOS and Android WebViews are excluded. That is why a business that needs the complete picture should supplement PageSpeed with real-user monitoring, then compare like for like instead of expecting the two reports to match perfectly.
Why does PageSpeed Insights show different results every time I run it? The Lighthouse section is a fresh simulated page load, and conditions can vary slightly between runs. It is built to help diagnose a page, not to describe every customer visit. Compare trends and the specific diagnostics, not a one-point movement in the circular score. The field section changes more slowly because it summarizes the prior 28 days of real Chrome visits.
The Same Page Can Feel Fast And Still Need Work
This is the part a score cannot decide for you.
A site can paint the first screen quickly but have a bad INP because a chat widget, a form provider, or a pile of JavaScript freezes the page after someone interacts with it. A site can pass a desktop lab run while customers on older phones wait for a large image to arrive over cellular data. A page can get a yellow Lighthouse score because the test caught a cold load in a strict environment, while repeat visitors with cached assets do fine.
None of those statements lets the site off the hook. They tell you where to look. A field failure is the thing to take seriously because it represents real visits. A lab failure is the thing to use for the repair, because it gives a developer a repeatable way to inspect the page.
That is why I would not pay someone to "get a 100." I would ask them which experience is poor, what is causing it, and what measurement will prove the repair worked. A perfect lab score on a page nobody can use is pointless. So is a developer dismissing a red field metric because their laptop feels fine.
What are the three Core Web Vitals? LCP measures when the main content becomes visible, INP measures how quickly the page responds after a click, tap, or key press, and CLS measures whether the layout moves around unexpectedly. Google evaluates all three at the 75th percentile of real page loads, split by mobile and desktop. A speed score may include other signals, but these are the three Core Web Vitals.
What Our Rebuild Actually Proved, And What It Did Not
We have a useful rebuild story here, with one limit worth saying out loud.
The First Trace
Before we moved this site off WordPress and Avada, a June 2026 mobile lab trace on a Pixel 7 class device with four-times CPU slowdown and Slow 4G measured an LCP of 4.386 seconds, a CLS of 0.17, and a TTFB of 1.941 seconds. That is not a small miss. LCP above four seconds is poor, and CLS above 0.1 needs work.
The Rebuild Check
The Astro rebuild changed the parts we could see in the later check: server response, page weight, and the amount of work the browser had to do before it could show the page. A July mobile-viewport check measured a 32 millisecond TTFB, 249 millisecond DOMContentLoaded, 463 millisecond load event, and 89 KB transfer size.
What We Can Say Honestly
- The old trace showed a serious server-response bottleneck and an LCP and CLS that needed work.
- The new check showed a much faster server response and a smaller transfer size, which is encouraging for the new build.
- The new check was an unthrottled live mobile viewport, not the same Pixel 7 and Slow 4G test. Its 89 KB transfer size is also not the same measurement as the old 1.0 to 1.3 MB Avada DOM.
- We did not re-measure LCP or CLS under the same conditions, so we do not claim an apples-to-apples Core Web Vitals improvement yet.
The right next step is to rerun the same mobile trace and keep the comparison honest. That is the difference between measuring a fix and collecting screenshots that make a fix look good. If the method changed, say so. You can still learn something useful from it, you just cannot pretend it answered a different question.
How To Read PageSpeed Insights Without Getting Sent In Circles
Start at the field section. If it has data, look at the red or amber Core Web Vital and the device tab. That is the real visitor problem you are trying to understand.
Use PageSpeed Insights to investigate one URL. Use Search Console's Core Web Vitals report to spot patterns across the site. Search Console groups similar URLs, while PageSpeed Insights usually reports on one URL or, when data is limited, the origin. That is why the two tools can describe the same problem differently.
Then use the lab section for the investigation. Look for the diagnostic that matches the metric instead of fixing every yellow line on the page. A slow LCP points you toward server response, the lead image, render-blocking resources, or render delay. A poor INP points you toward main-thread work and the interaction that froze. A high CLS points you toward elements loading without reserved space.
Then test the change again in the same lab conditions. You are looking for a directionally better trace, not a magic score. PageSpeed updates its trailing 28-day field data daily, so a fix can begin to appear before 28 days pass. Older visits stay in that window for a while, though, so do not declare victory because a test from this morning happened to go well.
Does no field data mean my website is slow? No. It usually means the URL or origin does not have enough qualifying Chrome user data in the Chrome User Experience Report. That is common for new sites and lower-traffic pages. Use the lab test to find obvious problems, then collect your own real-user data or check again once enough visitors have used the page. Do not turn an absence of data into a failing grade.
What A Useful Speed Fix Looks Like
A useful fix names the experience it is trying to improve and the condition that caused it. "We optimized your site speed" does neither.
For LCP, that may mean moving the site closer to the visitor, caching the HTML properly, shrinking or prioritizing the actual lead image, or removing a script that holds up the first render. For INP, it may mean cutting JavaScript, deferring a widget, or fixing the form that blocks the browser when someone taps it. For CLS, it usually means reserving space for images, embeds, banners, and fonts before they arrive.
Those are web design decisions as much as technical ones. A beautiful hero image that ships too late is not helping the page. A lead form that takes a beat too long to respond is not helping a paid click. This is why our web design work starts with what the site needs to do, then gets into the code and hosting that make it happen. It is also why a WordPress to Astro rebuild is sometimes the right answer and sometimes absolutely not. Moving platforms without knowing the bottleneck is an expensive guess.
What should I send my web developer from PageSpeed Insights? Send the URL, whether the issue is field or lab data, the device tab you were looking at, and the specific metric that is red or amber. A screenshot of a single score is not enough. LCP, INP, and CLS have different causes, and a developer cannot diagnose them from the same fix list. Give them the metric and the report link, then ask what changed after the fix.
Core Web Vitals Resource Center
Use the resource that matches the question you are trying to answer. Opening every tool at once usually adds more noise than clarity.
- PageSpeed Insights is the place to inspect one URL, separate field data from a Lighthouse test, and start a focused diagnosis.
- Search Console's Core Web Vitals report helps you find sitewide patterns by grouping similar URLs. Use it when one report looks like it may be part of a bigger template problem.
- CrUX Vis lets you explore Chrome User Experience Report history over time. It is useful when you need to see whether field data moved after a change rather than reacting to one day.
- Google's Core Web Vitals thresholds guide explains why the good, needs-improvement, and poor thresholds exist, including the 75th-percentile view used for assessment.
- Monitor Live Core Web Vitals in Chrome DevTools is a Chrome Developers video that walks through diagnosing LCP and INP locally, then comparing that work with CrUX field data.
How To Use PageSpeed Insights Results
Run PageSpeed Insights once, but do not stop at the score at the top. Check whether the report has real-user field data. If it does, start there. If it does not, use the lab trace as a list of things to inspect rather than a verdict about your customers.
Then pick one actual experience to fix. The large image taking forever to appear. The form that freezes after a tap. The page jumping before the visitor can click the phone number. Fix that, rerun the same test, and keep the before-and-after numbers next to the conditions that produced them.
That is my read on it. Your site may need a caching change, a smaller image, a cleaner template, or a deeper rebuild. If you want someone to separate the score from the problem, ask for a marketing analysis or get in touch. We can look at the report, the page, and the thing your visitors are actually trying to do.
Written by Joshua Jacoby, who has been building and ranking websites in the Phoenix metro since 2009. Learn more about how we work, the results we have built, and our SEO work.